Average Calculator
Calculate the average, or mean, of a set of numbers instantly by entering them. No signup. Ideal for grades, data, finances and any everyday averaging.
Share on Social Media:
This average calculator works out the average, or mean, of a set of numbers instantly, directly in your browser. Enter your numbers and see their average. No account, no install, so you can average grades, data, figures, or any set of numbers on any device in seconds.
How to Calculate an Average Step by Step
- Enter your numbers. Type or paste the set of numbers you want to average into the input, separating them so the tool can read each value.
- Calculate the average. The tool adds up all your numbers and divides by how many there are, working out the mean of the set.
- Read the average. The average appears, a single value representing the central, typical figure of your set of numbers.
- Check your numbers. Ensure all your intended numbers are included and entered correctly, since a missing or wrong value would change the average.
- Use the result. Use the average for your grades, data, finances, or whatever you are analysing, having the typical value of your set at a glance.

What an Average Is and How It Works
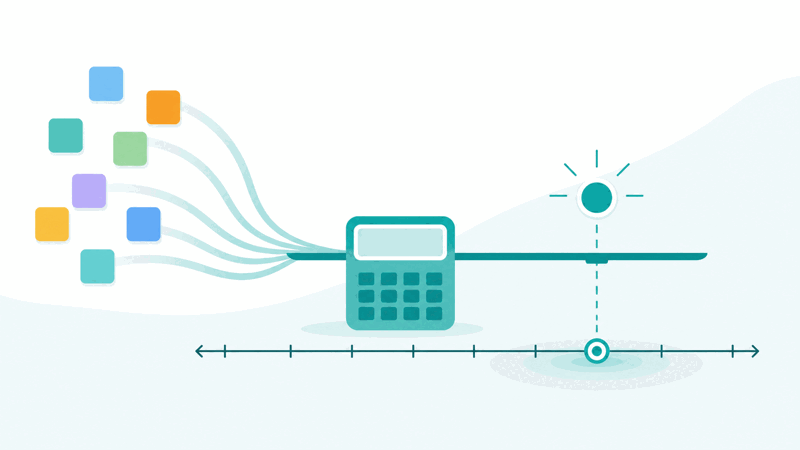
The average, more precisely the mean, is one of the most common and useful ways to summarise a set of numbers with a single representative value. It is calculated by adding up all the numbers and dividing by how many there are. This gives a central figure that represents the typical value of the set, which is why the average is so widely used to summarise data, from grades to finances to measurements.
The average works by balancing all the values into one figure. Because it sums every number and divides by the count, each value contributes to the result, and the average sits at the point that balances them. This makes it a good summary of the set as a whole, giving a sense of the typical or central value around which the numbers cluster, which is often exactly what you want to know about a group of numbers.
The average is one measure of the central value of data, alongside others like the median and mode. The average, or mean, is the balancing point that accounts for every value's size. The median is the middle value when sorted, and the mode is the most frequent. Each tells you something different, and the average is the most common, though it can be affected by extreme values, which is worth bearing in mind.
Averages are needed everywhere numbers are summarised: averaging test grades, working out typical spending, summarising measurements, analysing data, and countless everyday and professional tasks. Calculating an average by hand means summing all the numbers and dividing, which is tedious and error prone for large sets. An average calculator does this instantly and accurately for any set of numbers, making summarising data quick and reliable.
The Average Versus Other Measures
| Measure | What it is | Note |
|---|---|---|
| Average (mean) | Sum divided by the count | The balancing point |
| Median | The middle value when sorted | Less affected by extremes |
| Mode | The most frequent value | The most common |
| The average | Most commonly used | Can be pulled by extremes |
Who Uses an Average Calculator
Pro Tips for Working With Averages
Common Average Mistakes to Avoid
Related Tools You May Need Next
For the median and mode as well, our Mean Median Mode Calculator gives all three. The Percentage of a Number and sum tools help with related calculations.

Frequently Asked Questions
How do I calculate an average?
Enter or paste your set of numbers into the input, separating them so the tool can read each value, and it adds up all your numbers and divides by how many there are, working out the mean. The average appears instantly, a single value representing the central, typical figure of your set. Ensure all your intended numbers are included and entered correctly, since a missing or wrong value would change the average. This saves you from summing all the numbers and dividing by hand, which is tedious and error prone, especially for large sets.
What is an average?
The average, more precisely the mean, is one of the most common ways to summarise a set of numbers with a single representative value. It is calculated by adding up all the numbers and dividing by how many there are, giving a central figure that represents the typical value of the set. Because it sums every number and divides by the count, each value contributes, and the average sits at the point that balances them. This makes it a good summary of the set, giving a sense of the typical or central value around which the numbers cluster.
What is the difference between the average, median and mode?
The average, or mean, is the sum of all values divided by the count, giving the balancing point that accounts for every value's size. The median is the middle value when the numbers are sorted, which is less affected by extreme values. The mode is the most frequently occurring value. Each is a measure of the central or typical value but tells you something different. The average is the most commonly used, but it can be pulled up or down by extreme values, which is why the median is sometimes preferred for data with outliers.
Can extreme values affect the average?
Yes, because the average accounts for every value's size, a very high or very low value can pull the average up or down noticeably. This means the average of data containing extreme values, or outliers, may not represent the typical value of the set well, being skewed toward the extremes. It is worth bearing this in mind when interpreting an average. For data with extreme values, the median, the middle value when sorted, is less affected by outliers and may better represent the typical figure, so consider which measure suits your data.
When should I use the median instead of the average?
You should consider the median instead of the average when your data contains extreme values, or outliers, that distort the average. Because the average accounts for every value's size, extremes can pull it away from the typical value, whereas the median, the middle value when the numbers are sorted, is less affected by outliers. So for skewed data, the median may better represent the typical figure. A mean, median and mode calculator can give all three measures, letting you compare and choose the one that best represents your particular set of data.
What can I use an average for?
Averages are useful anywhere numbers are summarised: averaging test or assignment grades to find a typical score, working out typical spending or income in finances, summarising a set of measurements, analysing data to find its central value, and countless everyday and professional tasks. The average gives a single figure representing the typical value of a set, which is often exactly what you want to know about a group of numbers. Whenever you have several numbers and want to know their typical or central value, calculating the average provides a useful summary.
Why use a calculator instead of averaging by hand?
Because calculating an average by hand means summing all the numbers and dividing by the count, which is tedious and error prone, especially for large sets of numbers. A single arithmetic slip in adding the numbers, or an error in the division, gives a wrong average. An average calculator does the summing and dividing instantly and accurately for any set of numbers, however large, saving you effort and avoiding mistakes. So while you can average small sets by hand, the calculator is faster and more reliable, particularly valuable for large sets where manual calculation is impractical.
Is the average calculator free?
Yes, it is completely free with no account and no usage limit. You can calculate the average of as many sets of numbers as you like, as often as you like, at no cost. It runs entirely in your browser on any device, so there is nothing to download or install, and the average appears instantly whenever you enter your numbers, helping you summarise grades, data, finances, measurements, or any set of numbers with their typical, central value.